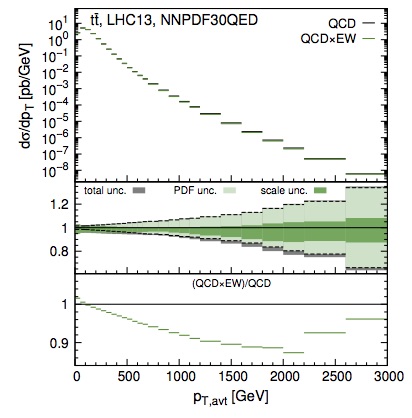
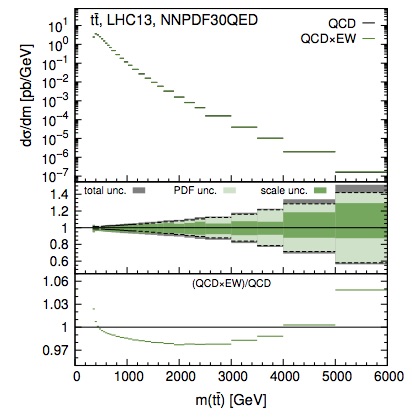
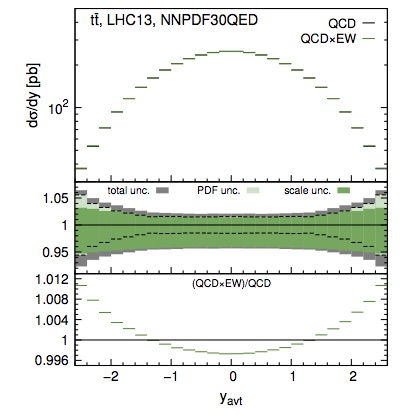
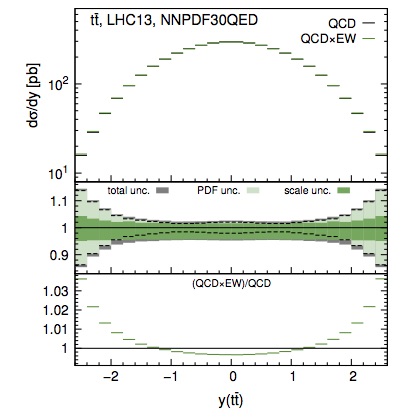
Comparison between NNLO QCD+EW versus multi jet-merged NLO QCD+EW (MEPS@NLO)
Here are some additional plots to the discussion in the Top2018 proceedings arXiv:1901.04442 by Michal Czakon, Christian Gütschow, Jonas M. Lindert, Alexander Mitov, Davide Pagani, Andrew S. Papanastasiou, Marek Schönherr, Ioannis Tsinikos, Marco Zaro.
In the following comparison (in pure QCD) we include also the NLO QCD prediction. Here are the top-pair differential distributions shown in the writeup above:
Here is a comparison with MEPS@NLO when evaluated with the same scale (HT/4):
Differential distributions for top-pair production in NNLO QCD + NLO EW
- LHC13-ttbar-CMS_bin-ancillary-files (mtop=173.3 GeV) and the corresponding plots
- LHC13-ttbar-CMS_bin-ancillary-files (mtop=172.5 GeV)
- Plots that compare the above two calculations and show the mtop sensitivity. Used LUXQED17 pdf set (same conclusions with NNPDF31)
Electronic files with LHC 13 TeV predictions for specific CMS bins (unpublished) for 3 pdf sets (LUXqed, LUXqed17 and NNPDF3.1). Results for all 7 scale combinations and all pdf members are made available. We provide predictions with both mtop=173.3 GeV and mtop=172.5 GeV; all other parameters are described in the corresponding README files inside the tarballs. Contains the usual 1-dim distributions. For the first time pT,top, pT,tbar and pT,avt are computed (same for the rapidity distributions). fastNLO tables with the pure QCD results for both values of mtop are available here.
Note: The distribution in |y(top)| – |y(tbar)| corresponds to the LHC charge asymmetry. One should keep in mind that the calculation has not been optimized for extracting that asymmetry, however, and the MC error – while small for the differential distribution – will be substantial for the asymmetry. In the dedicated AC calculation arXiv:1711.03945 (see below) a dedicated effort has been made to extract the asymmetry with small MC error.
- Plots of the difference between pttop and pttbar distributions with the corresponding MC errors. We show predictions in NLO, NNLO and QCDxEW for 3 pdf sets (LUXqed, LUXqed17 and NNPDF3.1).
Credits: for all plots and results above please cite arXiv:1705.04105. We would like to thank Andrew Papanastasiou for his assistance in the derivation of some of the results.
- Top quark charge asymmetry: LHC 13 TeV update of arXiv:1711.03945
Results are in full NNLO QCD + EW. Available in three separate files:
- README file fully documenting the results,
- Data files: a tarball contains the text files with binned predictions,
- Plots: a tarball containing the plots of all computed predictions.
Credits: We would like to thank Rene Poncelet for his kind help with the calculation of these results.
Additionally, we also provide the results for the above differential asymmetry’s numerators and denominators.
- Top quark charge asymmetry at LHC 13 TeV for 3 mtt slices:
- 750 GeV < mtt < 900 GeV ,
- mtt > 750 GeV ,
- mtt > 900 GeV .
- Results are in full NNLO QCD + EW.
- Provided separately are: AC , individual numerators and denominators.
Credits: We would like to thank Rene Poncelet for his kind help with the calculation of these results.
Electronic files with the NNLO QCD + EW predictions for the ttbar charge asymmetry at the LHC 8 TeV and Tevatron from the publication: Czakon, Heymes, Mitov, Pagani, Tsinikos, Zaro: arXiv:1711.03945. The tarball includes two README files explaining separately the LHC and Tevatron results.
Electronic files with Tevatron differential distributions. The predictions are accurate to NNLO QCD + NLO EW and utilize dynamic scales. Predictions with a static scale are also available for easier comparison with previous calculations. Publication: Czakon, Heymes, Mitov, Pagani, Tsinikos, Zaro: arXiv:1712.04842. A README file explaining the results is included.
Electronic files with the top-quark-pair differential distributions in NNLO QCD + NLO EW for LHC at 8 TeV and 13 TeV from the publication: Czakon, Heymes, Mitov, Pagani, Tsinikos, Zaro: arXiv:1705.04105.
Results available for download (single tarball including a README file with explanations):
for the following four distributions: mtt, ytt, yavt and pTavt. As a default pdf set we use LUXqed. Results based on the NNPDF3.0QED pdf set are provided as well.
- LHC 13 TeV, exp bins, mtop=173.3GeV (fastNLO tables through NNLO QCD are also available)
computed in NNLO QCD + NLO EW for the following distributions/bins:
- mtt: {300.0, 360.0, 430.0, 500.0, 580.0, 680.0, 800.0, 1000.0, 1200.0, 1500.0, 2500.0} GeV
- |ytt|: {0.0, 0.2, 0.4, 0.6, 0.8, 1.0, 1.2, 1.4, 1.6, 1.8, 2.4}
- |yavt|: {0.0, 0.2, 0.4, 0.6, 0.8, 1., 1.2, 1.4, 1.6, 1.8, 2.0, 2.5}
- pTavt, pT leading top, pT trailing top: {0.0, 40.0, 80.0, 120.0, 160.0, 200.0, 240.0, 280.0, 330.0, 380.0, 430.0, 500.0, 800.0} GeV
Plots are available upon request (note that the leading/trailing top pT distributions are new and have not been published before). The pT distributions are computed with scale mT(t1)/2 and mT(t2)/2 for t1 and t2, respectively. We have checked that, as for the case of averaged top, the results are very close to the ones derived with scale HT/4.
Additional materials:
- A recent presentation available online: (by Davide Pagani; 22 March 2017)
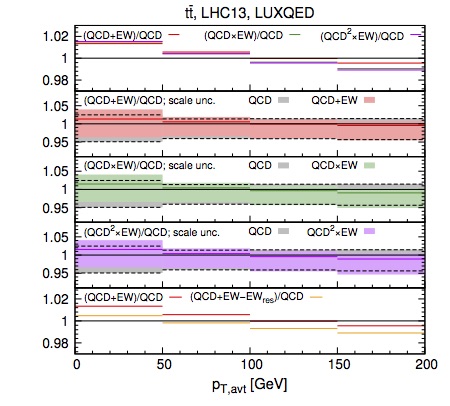
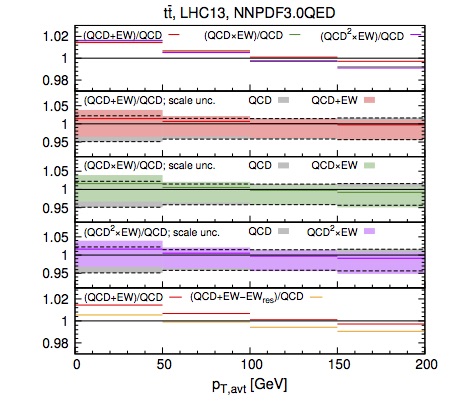
- Additional plots for LHC 13 TeV that are not included in the above publication (correspond to Fig. 1 in the paper; multiplicative approach with NNPDF3.0QED):
- Complete set of plots but for LHC 8 TeV (download as tar.gz file). These are not included in the above publication.
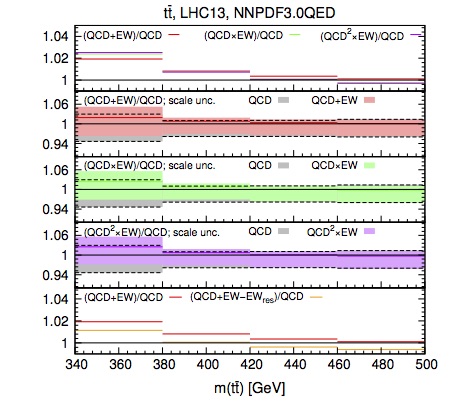
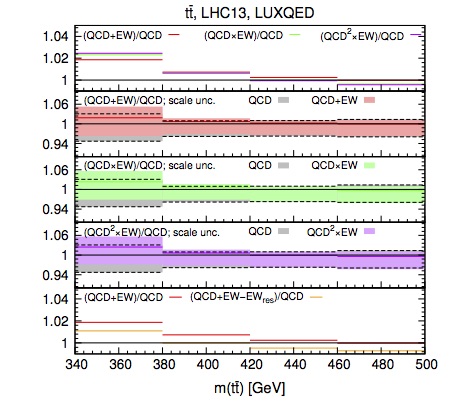
- Zoom-in of the threshold region of Fig. 4 in the paper. This demonstrates that, as expected, the additive and multiplicative approaches agree for small pT and Mtt.
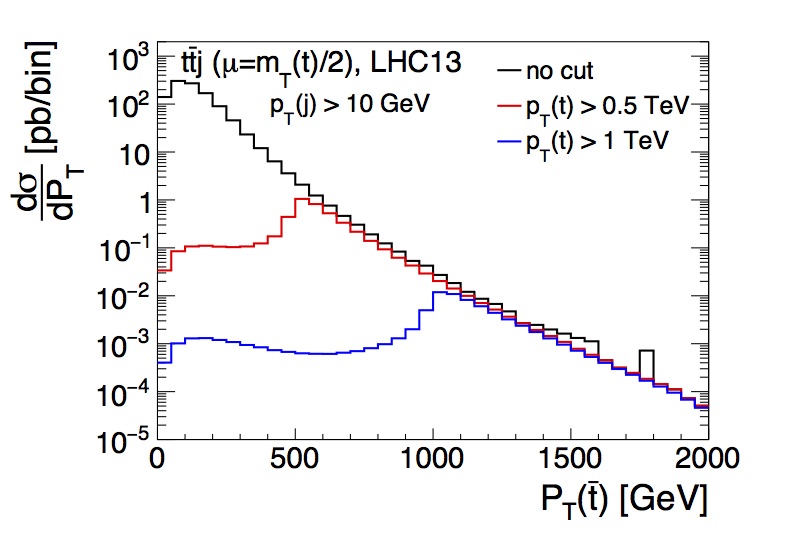
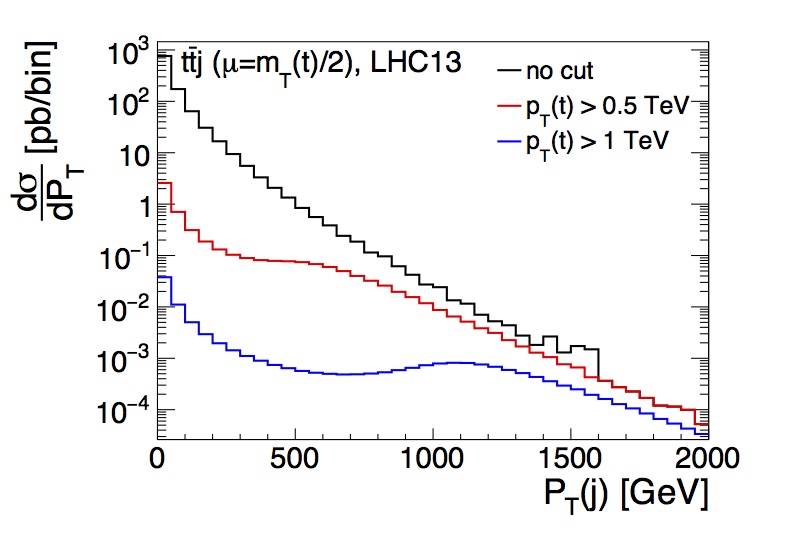
- Additional material for the discussion in sec.3.2 (see top of page 9 of the paper): Here we demonstrate that at large PTavt, the differential cross-section at NLO QCD is driven by configurations containing hard top, hard antitop (with the two being almost back-to-back) and a soft jet. This can be seen from the following two figures.
The figure to the left shows that the cross-section is dominated by “symmetric” configurations where the top and antitop have similar PT’s. This is true for a range of PT’s (two such cuts are chosen here: 500 GeV and 1000 GeV). The figure to the right shows that the peak of the cross-section (when PT(top) is large) corresponds to jets with small PT.
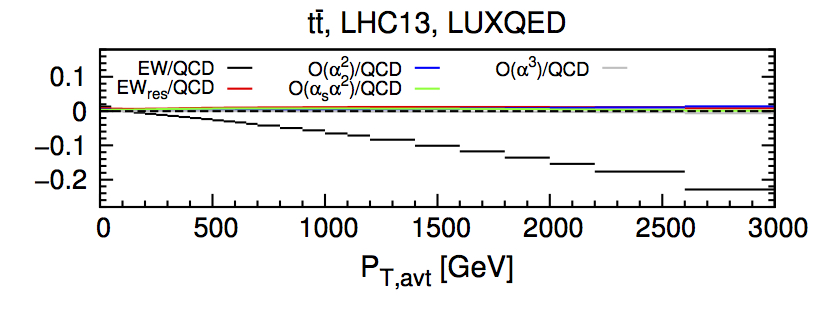
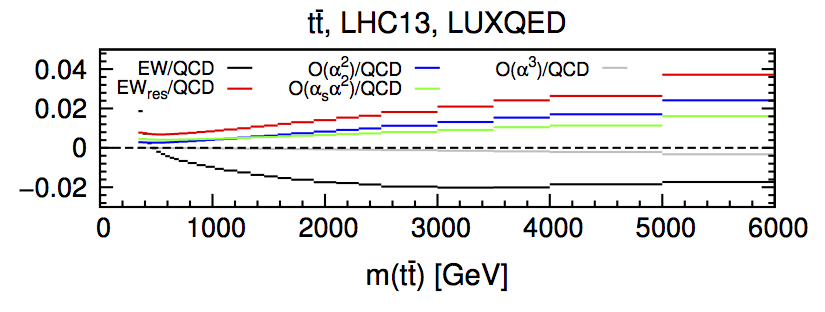
- Breakdown of the various contributions to EWres which is relevant for the discussion about fig.4 and fig.5 at the end of sec.3, bottom of page 11 of the paper.

